• About Us
  • Contact Us
Account
GTB
  • Home
  • News
  • Premium
  • Business
  • Personal Finance
  • Lifestyle
    • Travel
    • Health
    • Retail/Fashion
  • Podcast
    • Business Chat
    • Retiring Richly
    • Sika Nkommo
  • Videos
  • Analysis/Features
No Result
View All Result
  • Home
  • News
  • Premium
  • Business
  • Personal Finance
  • Lifestyle
    • Travel
    • Health
    • Retail/Fashion
  • Podcast
    • Business Chat
    • Retiring Richly
    • Sika Nkommo
  • Videos
  • Analysis/Features
No Result
View All Result
Account
Ghana Talks Business
No Result
View All Result

WEEKLY FOREX TECHNICAL ANALYSIS

07/08/2017
Reading Time: 1 min read
0
SHARES
Share on FacebookShare on TwitterShare on WhatsApp

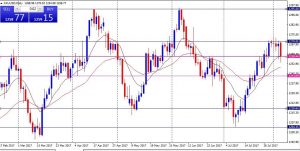
XAUUSD – SPOT GOLD TRADING RANGE STILL INTACT
Spot Gold has remain bounded within the 1295.00 – 1204.35 trading range for the past four months. Price tested 1270.05 near term resistance level last week and closed lower, but the current upward move remained intact. A push above this level will imply that price can go further to touch the 1295.00 ceiling of the trading range. Traders can look to go long this week to join the medium term upward momentum at any weakness in price within the 1258.44 – 1243.69 near term support zone on the 1 hour or 4 hour chart. However, a daily close below 1243.69 should erase any bullish sentiment.

SPOT GOLD, DAILY CHART

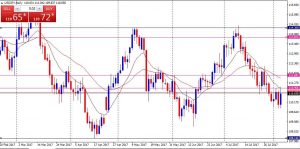
USDJPY – DOLLAR / YEN CONTINUES TO REMAIN RANGE BOUND
The Dollar/Yen has also been kept within the price range of 114.360 – 108.146 over the last four months. At the moment, price is surging lower towards the low of the trading range 108.146. Traders can look to short this week at any strength in price preferably within the 110.966 – 111.681 near term rally zone at any sell signal on the 1 hour or 4 hour chart. Notwithstanding, a daily close above 111.681 should clear away bearish sentiments.

DOLLAR/YEN, DAILY CHART

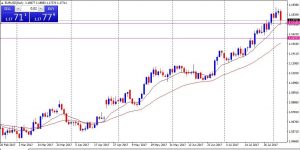
EURUSD – EURO/DOLLAR UPTREND REMAINS INTACT
The Euro/Dollar has been surging higher for the past four months, so the overall directional bias of this pair remains upwards. Traders can look to go long to join the upward steam this week at any pullback in price to the 1.1741 – 1.1577 near term support zone on either the 1 hour or 4 hour chart. We however cannot be much optimistic about further higher prices if a daily close below 1.1577 should occur.

EURO/DOLLAR, DAILY CHART


Author: E.O. ESSIEN
(TECHNICAL ANALYST)
Email: elijahotoo.eo@gmail.com (0240080104)

Previous Post

Ghana Talks Business TV: Richard Leigh

Next Post

The biggest secrets for turning your small business into a big business (Part 2)

Related Posts

MostBet Registration Bangladesh

29/12/2023

28/12/2023

Праздничные подарки от 1 win насладитесь Новым Годом с дополнительными выгодами!

22/12/2023

How does the sizing of sp5der clothing run

22/12/2023

Azərbaycanda rəsmi sayt

20/12/2023

Mostbet Casino Azərbaycan üçün imkanlarını təqdim edir

20/12/2023
Next Post

The biggest secrets for turning your small business into a big business (Part 2)

The Misplaced Promise of Africa’s Mobile Revolution

  • About Us
  • Disclaimer
  • Privacy Policy
  • Advertising
  • Contact Us

© 2023 Ghana Talks Business

No Result
View All Result
  • Home
  • News
  • Premium
  • Business
  • Personal Finance
  • Lifestyle
    • Travel
    • Health
    • Retail/Fashion
  • Podcast
    • Business Chat
    • Retiring Richly
    • Sika Nkommo
  • Videos
  • Analysis/Features
  • Login

© 2023 Ghana Talks Business

Welcome Back!

Login to your account below

Forgotten Password?

Retrieve your password

Please enter your username or email address to reset your password.

Log In