AUD/USD: AUSSID–DOLLAR RECOILS AT KEY SUPPORT
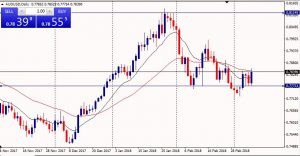
Aussid-dollar saw a correction from valid resistance level 0.8114 in January, but has now found valid support at 0.7772. The pair broke below this level but could not be contained below it as we saw price rally strongly above this level last week. This is an early indication that bulls have regained control over this market, ready to push prices higher from support.
 This presents early buying opportunities for traders to take long positions on the aussid–dollar pair this week. The profit potential of this trading plan may be up to previous key resistance 0.8114. Even so, this trading plan will be rendered invalid if price is to reverse and trade below 0.7772 on the daily chart.
USD/CHF: DOLLAR–SWISS ON A PULLBACK STRETCH
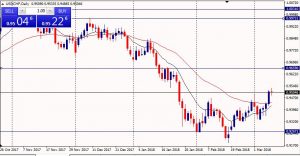
 The dollar – Swiss which has been trading lower for several months is now taking breath from the force of bears. The pair has failed to make lower-lows on two occasions – the trend continuation candles on February 22nd and March 1st both failed to push price lower past previous lower-lows. We shall stand aside to look for shorting opportunities in the direction of the downtrend on the daily chart at valid resistance levels. Near-term valid resistance is at 0.9659, however if price fails to reverse in the direction of the downtrend on the daily chart at this key resistance level, we shall switch to a ‘B’ plan, by keeping an eye at key boiling point resistance zone 0.9973 – 1.0031 where the daily chart would have formed a double-top candlestick pattern, creating opportunities to sell short.
SPX/USD: U.S STOCK INDEX, S&P 500 RESUMES UPWARD MOMENTUM
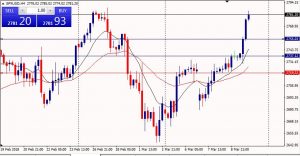
 The U.S stock index, S&P 500 which made several loses last month has now regained more than half of its lost value and almost back in ‘shape’. It is said that, the best time to buy a stock is when everybody else is selling. This wise statement has proved to be true time and time again, and has not failed to prove itself with the S&P 500. Those who bought the stock while others sold can now realise the potency of this wise statement.
Be that as it may, buying opportunities still prevails for ‘fearful’ bulls on the S&P 500, which is more truly valid this time. Several trading opportunities presents themselves as the stock retraces to mean price levels, using the 12 period EMA as reference point.
Traders may zoom-in unto the 4 hour chart and look forward for buying opportunities on the S&P 500 this week as price retraces to the 12 period EMA within the zone 2755.03 – 2737.12, a tight stop may be placed below 2719.03 on the 4 hour chart.
By E.O. ESSIEN
E.O Essien is an Associate Financial Economist, author, currency trader, and a private fund manager. He can be contacted via email at elijahotoo.eo@gmail.com or on +233203656160.


