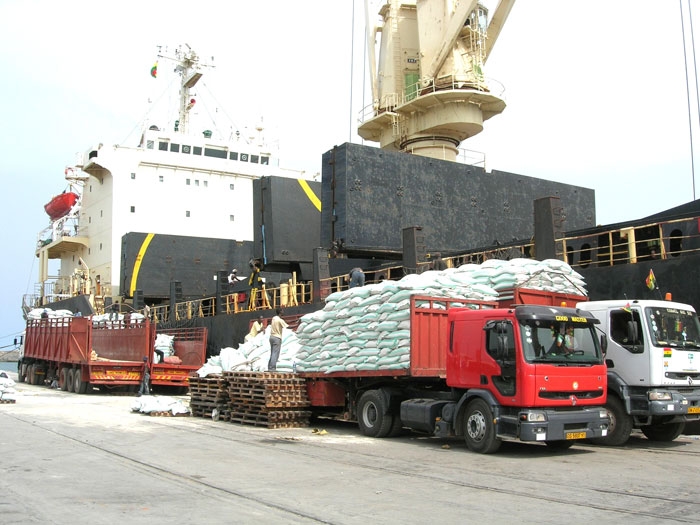
Ghana recorded over 15.1 million tonnes of maritime trade at its two seaports of Tema and Takoradi from January to December 2014, with imported frozen meat/food, rice, sugar, grains/flour being among the highest volumes of imported items.
This was made up of about 10.8 million tonnes of imports and 4.38 million tonnes of exports. The figure represents a decline of 14 percent of its performance compared to its operational year in 2013.
Available figures from the Ghana Shippers Authority obtained by B&FT showed that imported items such as frozen meat/foods recorded an appreciable surge — by 35 percent from 305,120 tonnes in 2013 to 413,299 in 2014 maritime trade period, while rice also recorded an increase of 53 percent from 36,884 tonnes in 2013 to 56,264 tonnes in 2014.
Sugar imports during the review period recorded a rise of 31 percent from 13,075 tonnes in 2013 to the 2014 figure of 17,076; while imported grains/flour recorded an increase of 134,241 in 2014 compared to the 2013 imported figure of 112,378 — representing a surge of 19 percent.
The data revealed that Tema Port handled over 71 percent of the total trade, which was over 11.4 million tonnes, while the Takoradi Port handled the remaining 4.3 million tonnes, representing about 25 percent of total trade for the period.
Additionally, total transit/transhipment through the two ports was only five percent of the total maritime trade.
Total imports for the review period was 15 percent less than what was obtained in the previous year, 2013, while total exports also declined, by over 12 percent under the previous year’s tonnage. Transit trade also recorded a decline of 17 percent in 2014 compared to the same period of 2013.
Total transit trade for the review period amounted to over 586,970 tonnes. This was a decline of 18 percent as compared to what was obtained in the previous year. The transit tonnage was made up of 577,628 tonnes of imports and 14,107 tonnes of exports.
Total imports for the review period was slightly above 10.8 million tonnes. This comprised 3.9 million tonnes of liner items, 2.0 million tonnes of break-bulk, 2.8 million tonnes of dry bulk items, and 2.0 million tonnes of liquid bulk items.
Again, maritime imports for the review period decreased by over 15 percent from what was obtained in the previous year. For the other types of trade, dry bulk import decreased by eight percent and liquid bulk by 31 percent.
The statistics revealed that liner import trade for 2014 is made up of items such as processed foods, which recorded about 461,545 tonnes, and chemicals amounting to over 382,230 tonnes.
Other items include tiles which had 353,882 tonnes; frozen meat and food recorded 413,299 tonnes; machinery and equipment had 130,965 tonnes; polythene raw materials was 345,048 tonnes; and bagged rice was 56,264 tonnes.
“The liner import trade for the review period fared ill as compared to the previous year. There was a general decline in total liner volume imported during the review period; but there were a number of individual items that saw increases in the quantities imported as compared to the previous year,” the data said.
The total break bulk import for 2014 was 2.0 million tonnes, or a 3 percent increase compared to 2013 for the review period.
Total dry bulk imports for the year 2014 amounted to over 2.8 million tonnes, an eight percent decrease from the performance of 2013. Clinker was the highest import item in this trade, recording over 1.85 million tones — an increase of 17 percent over the previous year’s tonnage.
There were declines in the tonnage of the following: cement, bulk wheat, Limestone and other dry bulk imports.
This trade showed an overall decrease of 31 percent during the review period. Most of the items saw decreases in the quantities imported compared to the figure recorded in 2013. Petroleum products decreased by 25 percent while Bitumen increased by 100 percent and Liquefied Petroleum Gas saw a decrease of 25 percent.
Export trade
The total export trade for the review period amounted to about 4.38 million tonnes. This was made upof over 1.5 million tonnes of liner items, 473,966 tonnes of break bulk items, and 2.2 million tonnes of dry bulk items.
The remaining 36,963 tonnes was made up of liquid bulk items.
Compared to the previous year’s total tonnage, the review year recorded a slightly over 11.7 percent increase in export trade.
The liner trade recorded an increase of 1 percent while the dry bulk trade recorded a decrease of over 25 percent. The liquid bulk trade recorded a decrease of nearly 55 percent. The 4.3 million tonnes of maritime export recorded for the review year 2014 was shipped to various destinations in the world. The majority of items exported went to the Far East and the North Continent ranges.
The Far East range received a total of 2.4 million tonnes representing 55 percent of total export, while the North Continent range had a tonnage of over 700,000 tonnes or 17 percent of total export.
Total transit trade for the period was 586,970 tonnes in 2014. This comprised 567,787 tonnes of import items for 90 percent of the total transit trade and 19,183 tonnes of export items. The total transit tonnage for the review period was over 17 percent less than what was recorded in 2014. All the transit countries including Burkina Faso, Mali and Niger recorded decreases in their performance.
The various transhipments destinations and tonnages through the seaports of Ghana
For the review period a total of 803,996 tonnes of transhipments passed through the Tema/Takoradi Ports. During the review period, imports amounted to 778,630 tonnes and exports amounted to 25,366 tonnes.
About 142 shipping agencies handled the over-15.1 million tonnes of maritime trade import and export through the Tema and Takoradi Ports during the review period.
Source: BFT


