In 2009, when mobile money (momo) was first introduced into the country, the service did not gain much traction as compared to other African countries. This was due to the Bank of Ghana’s restrictive 2008 Branchless Banking Guidelines.
MoMo Payments top non-cash payment options
A few years down the line, the Bank of Ghana (BoG) revised the banking regulations and eventually released new agent and e-money guidelines. The new regulations allowed mobile network operators (MNOs) to own and operate mobile money services under their supervision. This will be the precursor to momo taking over the financial system.
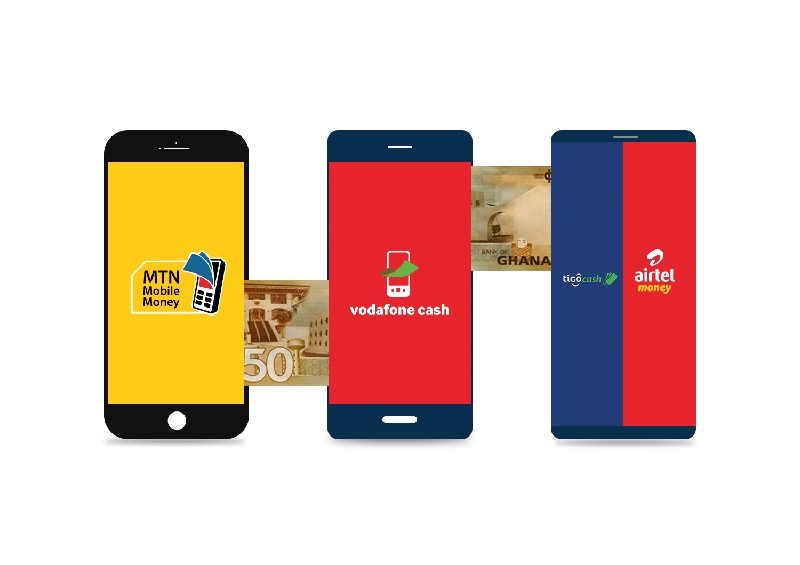
MTN Ghana is the biggest active player in the industry. MTN mobile money has 75% of the country’s active accounts. Vodafone Ghana and Airtel/Tigo also have their share of the mobile money market.
AN INTERESTING READ: Ghana tipped to be the fastest-growing mobile money market in Africa
According to the Bank of Ghana 2020 Annual Report;
“total value of mobile money transactions grew by 82.4 per cent to GH¢564.16 billion at end-December 2020, while the total float balance increased by 92.1 per cent to GH¢6.98 billion.”
“Registered mobile money account holders increased by 18.5 per cent to 38,473,734 at end-December 2020,” the report further stated.
These record-breaking numbers indicate that momo payments are the preferred and dominant financial transaction system over any other non-cash payment options (E-Zwich Transactions, ATMs, GhiPSS Instant Pay) among others.
The table below gives a comparison of the payment systems in terms of Volume of transaction and value of the transaction.
| Table 1 : Comparative Payment Statistics, 2017-2020 | |||||
| 2017 | 2018 | 2019 | 2020 | ||
| Cheque Code Clearing | Volume Value (GH¢ million) | 7,334,460 179, 555.47 | 7,255,220 203,465.32 | 6,831,417 173,623.25 | 5,903,331 177,625 |
| Gh-Link (National Switch) | Volume Value (GH¢ million) | 2,340,409 603.43 | 1,830,182 543.74 | 972,746 329.23 | 806,486 329.7 |
| E-Zwich | Volume of Transactions Value of Transactions (GH¢ million) | 8,367,017 3,431.49 | 7,759,354 5,651.14 | 10,796,560 6,308.37 | 10,477,601 9,033.25 |
| GhiPSS Instant Pay | Volume of Transactions Value of Transactions (GH¢ million) | 41,795 83.23 | 143,879 534.04 | 1,905,267 3,456.89 | 6,804,754 9146.76 |
| Mobile Money | Volume of Transactions Value of Transactions (GH¢ million) | 981,564,563 155,844.84 | 1,454,470,801 223,207.23 | 2,009,989,300 309,352.25 | 2,859,624,191 564,155.90 |
| ATMs | Volume of Transactions Value of Transactions (GH¢ million) | 57,317,491 18,542.95 | 57,763,558 21,796.49 | 55,709,252 26,392.44 | 56,6032,11 32,148.03 |
| Source: Bank of Ghana |
From the table above, mobile money has had the highest volume of transactions since 2017 and the highest value of transactions since 2018. The figures thus reveal how momo has taken over from other financial systems
Why mobile money rose to polarity
Although the Bank of Ghana revised its regulations which opened the floodgates for new players to enter into the sector, there are additional reasons why mobile money grew to become the preferred financial transaction service amongst Ghanaians. This is explained in the image below.


