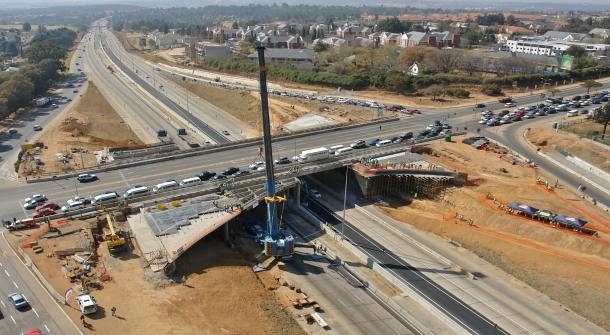
The high profile of infrastructure and access to related services in the communiques of the World Bank and the International Monetary Fund (IMF) at their annual meetings in late 2014 underscores the importance of this issue for development worldwide. Nowhere is lack of infrastructure more crucial and potentially transformational than in sub-Saharan Africa. In 2009, the World Bank and major donors and multilateral institutions investigated this challenge of addressing the region’s glaring infrastructure gap. That comprehensive regional analysis aimed to establish “a baseline against which future improvements in infrastructure services can be measured” and guide priority investments and policy reforms. The analysis estimated that the region needed $93 billion per year to fill the infrastructure gap.
In the five years since the study, the response in tackling the infrastructure gap has been unprecedented, especially in terms of increased financing. Although it is too early to expect substantive results from these efforts, given the long gestation period of infrastructure investments, it is important at this time to review and analyze how this response is distributed across the countries of sub-Saharan Africa and the different infrastructure sectors/sub-sectors. Are there “orphan” sectors or countries that should be the subject of targeted emphasis? Is there an appropriate balance between regional, national, and sub-national infrastructure? Is there sufficient attention to global governance that would ensure strategic coordination, and to sectoral governance that would reduce additional financing requirements through increased efficiency and thereby better ensure sustainability? The purpose of this paper is to begin that conversation by analyzing how the main sources of infrastructure financing have evolved over the last eight years, the distribution of that financing by country and sector, and how financing efforts have responded to the recommendations made in 2009. Thus, this paper offers recommendations on how to better exploit the political, technical, and financial synergies needed to address the infrastructure gap. It is not feasible in this analysis to assess specific investments against actual needs by country and sector, and so this report underscores the need for an update of the 2009 study.
The paper begins with an analysis of the three major sources of external financing: private participation in infrastructure (PPI) investments; official development finance (ODF) from multilateral institutions and most of the OECD-DAC donors; and official Chinese financing. Although there are challenges to compiling the financing data in a comparable manner, the information is sufficient to establish the pattern of support across countries and sectors. This analysis is followed by a review of domestic public funding. This paper also discusses the governance issues that are critical to ensuring the economic, social, and environmental sustainability of these investment outcomes.
The Surge in Financing
Composition of external financing is changing: Overall financing for infrastructure in sub-Saharan Africa across the three major external sources has tripled between 2004 and 2012 with few, if any, lingering signs of receding investments during the worldwide recession. During this period, while the level of ODF increased—especially from the World Bank and the African Development Bank (AfDB)—the dominance of ODF in infrastructure financing declined as private investment surged to over 50 percent of external financing, and China became a major bilateral source. The most striking feature of this surge is the changing share of financing offered by traditional and non-traditional partners and private sector sources, posing great opportunities as well as challenges for sub-Saharan Africa.
This funding increase, moreover, has benefitted a wide range of sub-Saharan African countries. Some countries get more and some less; but there are no clear “orphans” except for a limited number of fragile states facing serious governance issues. In absolute terms, the top recipients of external financing for 2009-2012 are concentrated in the five large economies—South Africa, Nigeria, Ghana, Kenya, and Ethiopia—although their order varies slightly depending on the financing source. However, a more interesting picture emerges when controlling for the size of the economy. Four of the top six recipient countries on the basis of external financing per dollar of GDP are classified as fragile states/situations. For example, support to Liberia between 2009 and 2012 exceeded 25 percent of its GDP.
Viewed from a sectoral perspective, the distribution of external finance illustrates the preference and criteria of the various sources. The energy sector has had the fastest growth across all external financing sources since 2009: It now attracts 45 percent of the total external finance. Although private investment is significant and serves a broad range of countries, historically it has been concentrated in the telecommunications (or ICT) sector. Excluding telecom, private finance for other sectors, especially energy, is highly concentrated in a few countries. Official Chinese investments are now expanding beyond the country’s earlier focus on financing for resource-rich economies and is reaching sectors in which it has particular technical expertise—such as hydropower—and those that are not as amenable to the private sector—such as transport (especially road and rail). ODF offers support to a wide range of countries, given World Bank and AfDB allocation criteria, as well as across infrastructure sectors with the exception of telecom. ODF appears to be the only significant external financing source for water and sanitation projects besides public sector budgets.
Credit: Brooking Institute


